

Functioneel beheer - Response tijdenFunctional management - Response times
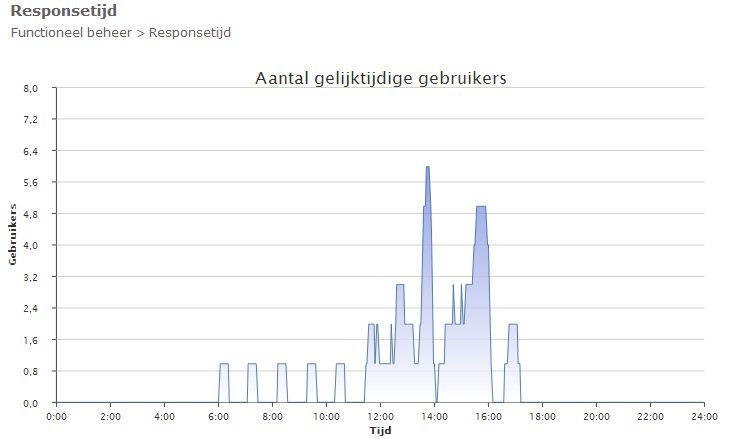
Bij de response tijden worden overzichten/grafieken getoond om inzicht in de responsetijd, hits, aantal gelijktijdige gebruikers en sessies gegeven.
At the response times, overviews/graphs are shown in order to give insight into the response time, hits, number of concurrent users and sessions.
De responsetijd is de reactietijd die verstrijkt tussen het starten van een taak in Mozard en het tijdstip waarop de gebruiker weer opdrachten aan het systeem kan geven, waarbij de taak nog niet geheel door het systeem uitgevoerd behoeft te zijn.
The response time is the reaction time that elapses between the starting of a task in Mozard and the moment at which the user can give the system commands again, where the task does not yet have to have been carried out in full by the system.
Via het rechter menu van het scherm responstijd zijn de opties Grafiek, Gelijktijdige gebruikers en de Realtime grafiek op te roepen.
Through the right-hand menu of the responstijd screen the options Grafiek, Gelijktijdige gebruikers and the Realtime grafiek can be called up.
Zie ookSee also
Vragen over dit onderwerpQuestions on this topic
Wat toont de grafiek gelijktijdige gebruikers?What does the concurrent users graph show?
Wat toont de realtime grafiek?What does the realtime graph show?
Wat toont de verwijzing grafiek?What does the reference graph show?
Wat toont het overzicht responsetijd?What does the responsetijd overview show?